
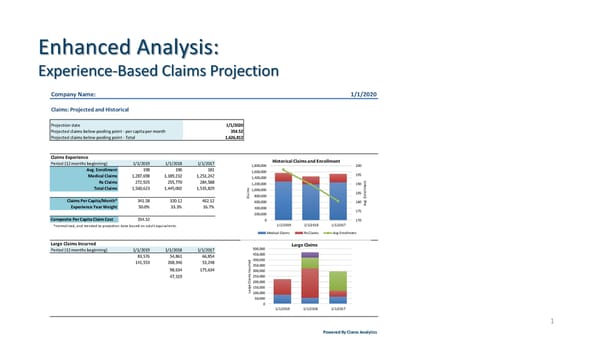
Enhanced Analysis: Experience-Based Claims Projection Company Name: 1/1/2020 Claims: Projected and Historical Projection date 1/1/2020 Projected claims below pooling point - per capita per month 354.52 Projected claims below pooling point - Total 1,626,812 Claims Experience Historical Claims and Enrollment Period (12 months beginning) 1/1/2019 1/1/2018 1/1/2017 1,800,000 200 Avg. Enrollment 198 190 181 1,600,000 Medical Claims 1,287,698 1,189,232 1,251,242 1,400,000 195 Rx Claims 272,925 255,770 284,588 1,200,000 190 t en s m Total Claims 1,560,623 1,445,002 1,535,829 l m1,000,000 l i 185 o a r 800,000 n Cl E . Claims Per Capita/Month* 341.58 320.12 462.12 600,000 180 g Experience Year Weight 50.0% 33.3% 16.7% 400,000 Av 200,000 175 Composite Per Capita Claim Cost 354.52 0 170 *normalized, and trended to projection date based on adult equivalents. 1/1/2019 1/1/2018 1/1/2017 Medical Claims Rx Claims Avg Enrollment Large Claims Incurred Large Claims Period (12 months beginning) 1/1/2019 1/1/2018 1/1/2017 500,000 83,576 54,861 66,854 450,000 141,553 268,346 53,248 ed400,000 r r350,000 u 98,634 175,634 c n300,000 I s250,000 47,319 m i a l200,000 C e g150,000 r a L100,000 50,000 0 1/1/2019 1/1/2018 1/1/2017 1 Powered By Claros Analytics
 Claros Analytics Overview Page 10 Page 12