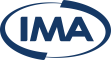
Enhanced Analytics: RDS Fully Insured to Self-Funded Analysis Company Name: Dewey, Countem, & Howe Plan Effective Date: 1/1/2020 Fully Insured vs Self-Funded Probability of Outperforming FI Fully Insured Rate (FI) SL Structure 1 SL Structure 2 76% 75.5% Fully Insured Premium $2,700,000 $2,700,000 75% 75% Self-Funding SL Structure 1 SL Structure 2 75% Specific Deductible 50,000 75,000 74.8% Aggregate Margin 125% 125% 75% Expected Cost to Self Insure $2,576,323 $2,543,816 75% Expected Savings/(Expense) vs. FI $123,677 $156,184 Probability of Outperforming FI 74.8% 75.5% 74% SL Structure 1 SL Structure 2 Aggregate Attachment Point $2,077,368 $2,256,577 Probability of Reaching Max. Cost Maximum Cost* $2,973,822 $2,975,606 Probability of Reaching Maximum Cost 1.7% 2.9% 3.5% * Maximum Cost is the Aggregate Attachment Point plus Expenses 3.0% 2.9% 2.5% 2.0% 1.7% Expected Cost to Self Insure SL Structure 1 SL Structure 2 1.5% Estimated Claims Payable by the Plan $1,712,323 $1,847,816 1.0% Stop Loss Premium $756,000 $588,000 Administration Expenses $108,000 $108,000 0.5% Total Expected Cost to Self Insure $2,576,323 $2,543,816 0.0% SL Structure 1 SL Structure 2 1
 Claros Analytics Overview Page 8 Page 10