
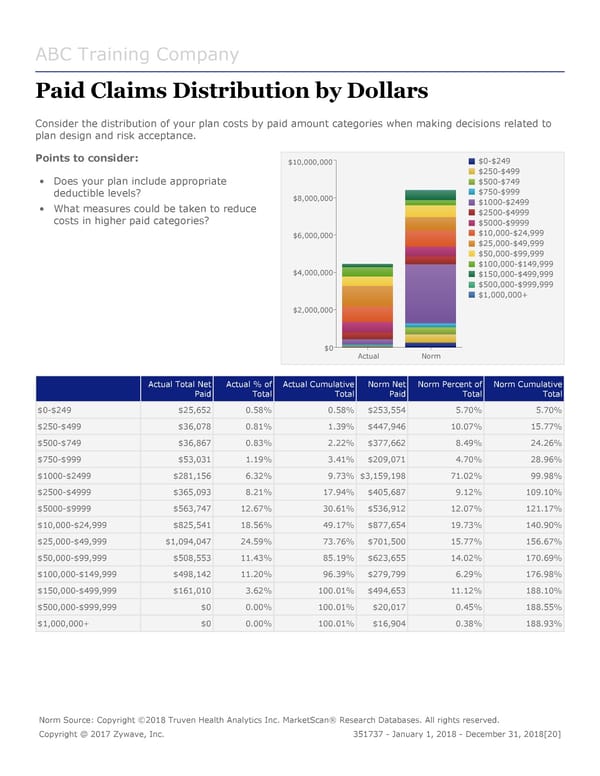
ABC Training Company Paid Claims Distribution by Dollars Consider the distribution of your plan costs by paid amount categories when making decisions related to plan design and risk acceptance. Points to consider: $10,000,000 $0-$249 $250-$499 • Does your plan include appropriate $500-$749 deductible levels? $8,000,000 $750-$999 • What measures could be taken to reduce $1000-$2499 costs in higher paid categories? $2500-$4999 $5000-$9999 $6,000,000 $10,000-$24,999 $25,000-$49,999 $50,000-$99,999 $100,000-$149,999 $4,000,000 $150,000-$499,999 $500,000-$999,999 $1,000,000+ $2,000,000 $0 Actual Norm Actual Total Net Actual % of Actual Cumulative Norm Net Norm Percent of Norm Cumulative Paid Total Total Paid Total Total $0-$249 $25,652 0.58% 0.58% $253,554 5.70% 5.70% $250-$499 $36,078 0.81% 1.39% $447,946 10.07% 15.77% $500-$749 $36,867 0.83% 2.22% $377,662 8.49% 24.26% $750-$999 $53,031 1.19% 3.41% $209,071 4.70% 28.96% $1000-$2499 $281,156 6.32% 9.73% $3,159,198 71.02% 99.98% $2500-$4999 $365,093 8.21% 17.94% $405,687 9.12% 109.10% $5000-$9999 $563,747 12.67% 30.61% $536,912 12.07% 121.17% $10,000-$24,999 $825,541 18.56% 49.17% $877,654 19.73% 140.90% $25,000-$49,999 $1,094,047 24.59% 73.76% $701,500 15.77% 156.67% $50,000-$99,999 $508,553 11.43% 85.19% $623,655 14.02% 170.69% $100,000-$149,999 $498,142 11.20% 96.39% $279,799 6.29% 176.98% $150,000-$499,999 $161,010 3.62% 100.01% $494,653 11.12% 188.10% $500,000-$999,999 $0 0.00% 100.01% $20,017 0.45% 188.55% $1,000,000+ $0 0.00% 100.01% $16,904 0.38% 188.93% Norm Source: Copyright ©2018 Truven Health Analytics Inc. MarketScan® Research Databases. All rights reserved. Copyright @ 2017 Zywave, Inc. 351737 - January 1, 2018 - December 31, 2018[20]
 DMW Sample Report Page 19 Page 21