
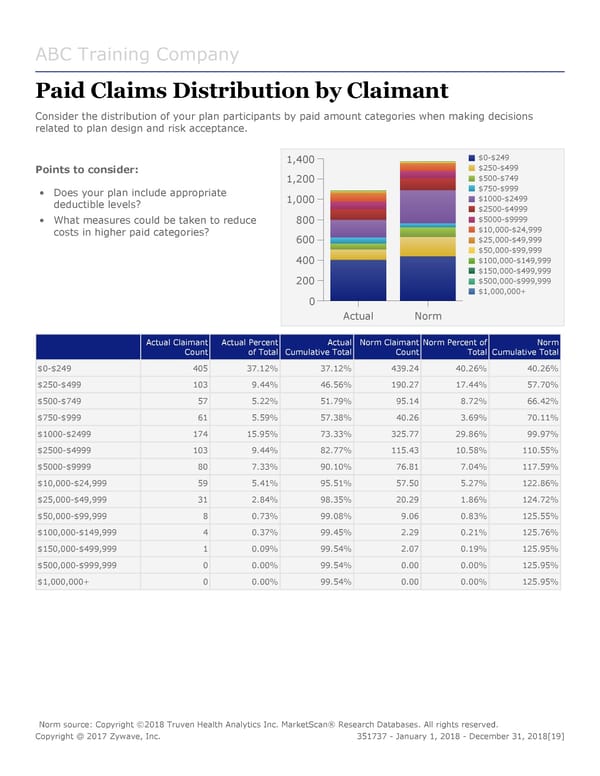
ABC Training Company Paid Claims Distribution by Claimant Consider the distribution of your plan participants by paid amount categories when making decisions related to plan design and risk acceptance. 1,400 $0-$249 Points to consider: $250-$499 1,200 $500-$749 • Does your plan include appropriate $750-$999 deductible levels? 1,000 $1000-$2499 $2500-$4999 • What measures could be taken to reduce 800 $5000-$9999 costs in higher paid categories? $10,000-$24,999 600 $25,000-$49,999 $50,000-$99,999 400 $100,000-$149,999 $150,000-$499,999 200 $500,000-$999,999 $1,000,000+ 0 Actual Norm Actual Claimant Actual Percent Actual Norm Claimant Norm Percent of Norm Count of Total Cumulative Total Count Total Cumulative Total $0-$249 405 37.12% 37.12% 439.24 40.26% 40.26% $250-$499 103 9.44% 46.56% 190.27 17.44% 57.70% $500-$749 57 5.22% 51.79% 95.14 8.72% 66.42% $750-$999 61 5.59% 57.38% 40.26 3.69% 70.11% $1000-$2499 174 15.95% 73.33% 325.77 29.86% 99.97% $2500-$4999 103 9.44% 82.77% 115.43 10.58% 110.55% $5000-$9999 80 7.33% 90.10% 76.81 7.04% 117.59% $10,000-$24,999 59 5.41% 95.51% 57.50 5.27% 122.86% $25,000-$49,999 31 2.84% 98.35% 20.29 1.86% 124.72% $50,000-$99,999 8 0.73% 99.08% 9.06 0.83% 125.55% $100,000-$149,999 4 0.37% 99.45% 2.29 0.21% 125.76% $150,000-$499,999 1 0.09% 99.54% 2.07 0.19% 125.95% $500,000-$999,999 0 0.00% 99.54% 0.00 0.00% 125.95% $1,000,000+ 0 0.00% 99.54% 0.00 0.00% 125.95% Norm source: Copyright ©2018 Truven Health Analytics Inc. MarketScan® Research Databases. All rights reserved. Copyright @ 2017 Zywave, Inc. 351737 - January 1, 2018 - December 31, 2018[19]
 DMW Sample Report Page 18 Page 20