
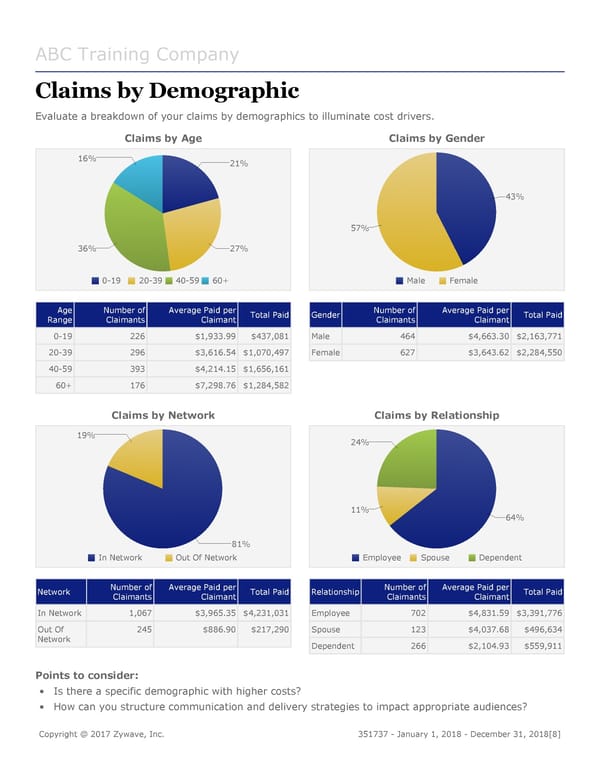
ABC Training Company Claims by Demographic Evaluate a breakdown of your claims by demographics to illuminate cost drivers. Claims by Age Claims by Gender 16% 21% 43% 57% 36% 27% 0-19 20-39 40-59 60+ Male Female Age Number of Average Paid per Total Paid Gender Number of Average Paid per Total Paid Range Claimants Claimant Claimants Claimant 0-19 226 $1,933.99 $437,081 Male 464 $4,663.30 $2,163,771 20-39 296 $3,616.54 $1,070,497 Female 627 $3,643.62 $2,284,550 40-59 393 $4,214.15 $1,656,161 60+ 176 $7,298.76 $1,284,582 Claims by Network Claims by Relationship 19% 24% 11% 64% 81% In Network Out Of Network Employee Spouse Dependent Network Number of Average Paid per Total Paid Relationship Number of Average Paid per Total Paid Claimants Claimant Claimants Claimant In Network 1,067 $3,965.35 $4,231,031 Employee 702 $4,831.59 $3,391,776 Out Of 245 $886.90 $217,290 Spouse 123 $4,037.68 $496,634 Network Dependent 266 $2,104.93 $559,911 Points to consider: • Is there a specific demographic with higher costs? • How can you structure communication and delivery strategies to impact appropriate audiences? Copyright @ 2017 Zywave, Inc. 351737 - January 1, 2018 - December 31, 2018[8]
 DMW Sample Report Page 7 Page 9