
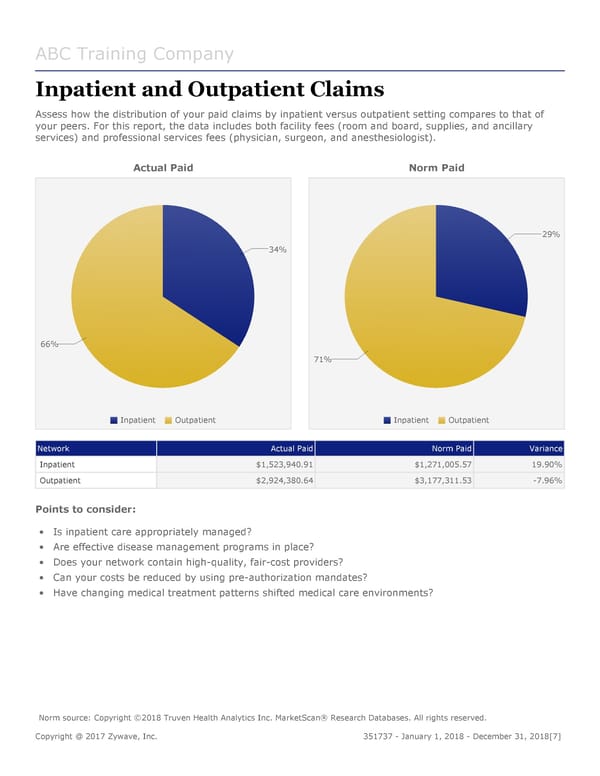
ABC Training Company Inpatient and Outpatient Claims Assess how the distribution of your paid claims by inpatient versus outpatient setting compares to that of your peers. For this report, the data includes both facility fees (room and board, supplies, and ancillary services) and professional services fees (physician, surgeon, and anesthesiologist). Actual Paid Norm Paid 29% 34% 66% 71% Inpatient Outpatient Inpatient Outpatient Network Actual Paid Norm Paid Variance Inpatient $1,523,940.91 $1,271,005.57 19.90% Outpatient $2,924,380.64 $3,177,311.53 -7.96% Points to consider: • Is inpatient care appropriately managed? • Are effective disease management programs in place? • Does your network contain high-quality, fair-cost providers? • Can your costs be reduced by using pre-authorization mandates? • Have changing medical treatment patterns shifted medical care environments? Norm source: Copyright ©2018 Truven Health Analytics Inc. MarketScan® Research Databases. All rights reserved. Copyright @ 2017 Zywave, Inc. 351737 - January 1, 2018 - December 31, 2018[7]
 DMW Sample Report Page 6 Page 8