
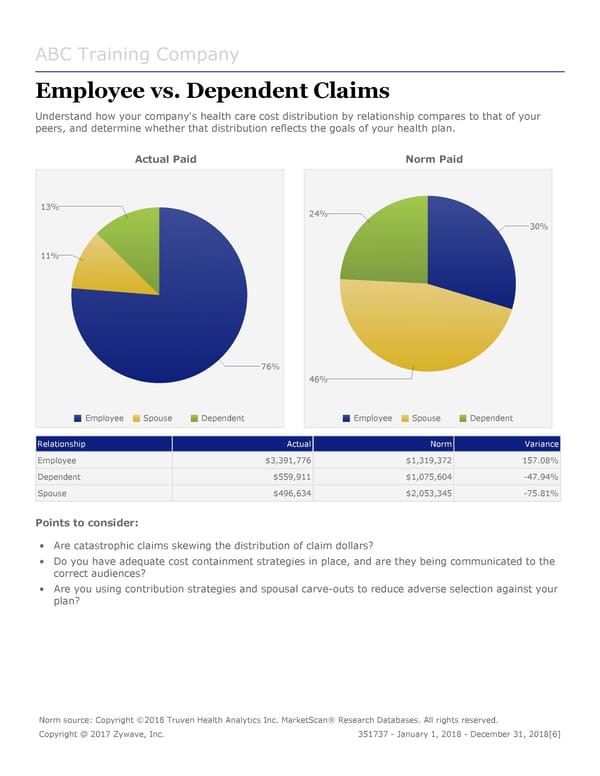
ABC Training Company Employee vs. Dependent Claims Understand how your company's health care cost distribution by relationship compares to that of your peers, and determine whether that distribution reflects the goals of your health plan. Actual Paid Norm Paid 13% 24% 30% 11% 76% 46% Employee Spouse Dependent Employee Spouse Dependent Relationship Actual Norm Variance Employee $3,391,776 $1,319,372 157.08% Dependent $559,911 $1,075,604 -47.94% Spouse $496,634 $2,053,345 -75.81% Points to consider: • Are catastrophic claims skewing the distribution of claim dollars? • Do you have adequate cost containment strategies in place, and are they being communicated to the correct audiences? • Are you using contribution strategies and spousal carve-outs to reduce adverse selection against your plan? Norm source: Copyright ©2018 Truven Health Analytics Inc. MarketScan® Research Databases. All rights reserved. Copyright @ 2017 Zywave, Inc. 351737 - January 1, 2018 - December 31, 2018[6]
 DMW Sample Report Page 5 Page 7