
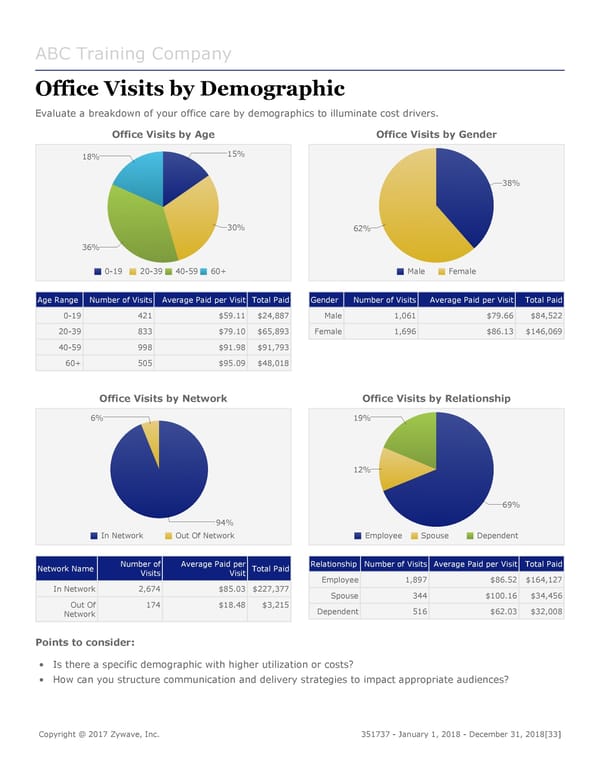
ABC Training Company Office Visits by Demographic Evaluate a breakdown of your office care by demographics to illuminate cost drivers. Office Visits by Age Office Visits by Gender 18% 15% 38% 30% 62% 36% 0-19 20-39 40-59 60+ Male Female Age Range Number of Visits Average Paid per Visit Total Paid Gender Number of Visits Average Paid per Visit Total Paid 0-19 421 $59.11 $24,887 Male 1,061 $79.66 $84,522 20-39 833 $79.10 $65,893 Female 1,696 $86.13 $146,069 40-59 998 $91.98 $91,793 60+ 505 $95.09 $48,018 Office Visits by Network Office Visits by Relationship 6% 19% 12% 69% 94% In Network Out Of Network Employee Spouse Dependent Network Name Number of Average Paid per Total Paid Relationship Number of Visits Average Paid per Visit Total Paid Visits Visit Employee 1,897 $86.52 $164,127 In Network 2,674 $85.03 $227,377 Spouse 344 $100.16 $34,456 Out Of 174 $18.48 $3,215 Dependent 516 $62.03 $32,008 Network Points to consider: • Is there a specific demographic with higher utilization or costs? • How can you structure communication and delivery strategies to impact appropriate audiences? Copyright @ 2017 Zywave, Inc. 351737 - January 1, 2018 - December 31, 2018[33]
 DMW Sample Report Page 32 Page 34