
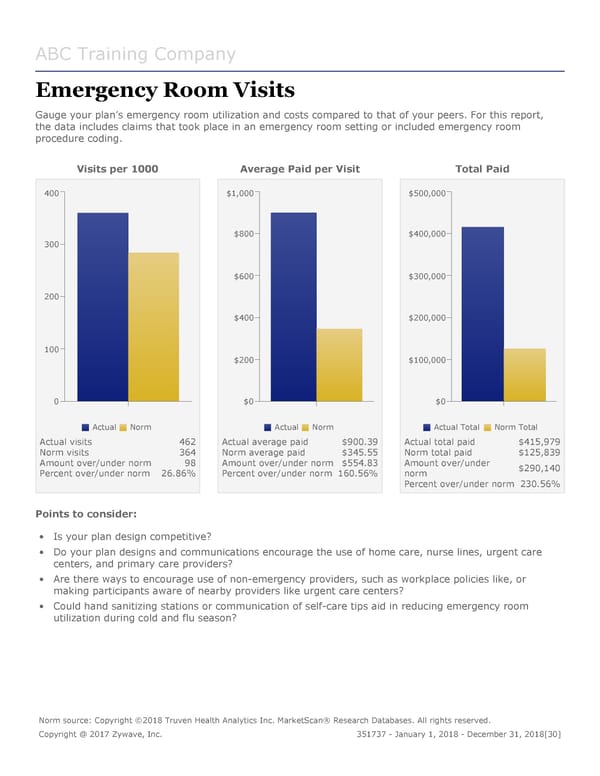
ABC Training Company Emergency Room Visits Gauge your plan’s emergency room utilization and costs compared to that of your peers. For this report, the data includes claims that took place in an emergency room setting or included emergency room procedure coding. Visits per 1000 Average Paid per Visit Total Paid 400 $1,000 $500,000 $800 $400,000 300 $600 $300,000 200 $400 $200,000 100 $200 $100,000 0 $0 $0 Actual Norm Actual Norm Actual Total Norm Total Actual visits 462 Actual average paid $900.39 Actual total paid $415,979 Norm visits 364 Norm average paid $345.55 Norm total paid $125,839 Amount over/under norm 98 Amount over/under norm $554.83 Amount over/under $290,140 Percent over/under norm 26.86% Percent over/under norm 160.56% norm Percent over/under norm 230.56% Points to consider: • Is your plan design competitive? • Do your plan designs and communications encourage the use of home care, nurse lines, urgent care centers, and primary care providers? • Are there ways to encourage use of non-emergency providers, such as workplace policies like, or making participants aware of nearby providers like urgent care centers? • Could hand sanitizing stations or communication of self-care tips aid in reducing emergency room utilization during cold and flu season? Norm source: Copyright ©2018 Truven Health Analytics Inc. MarketScan® Research Databases. All rights reserved. Copyright @ 2017 Zywave, Inc. 351737 - January 1, 2018 - December 31, 2018[30]
 DMW Sample Report Page 29 Page 31