
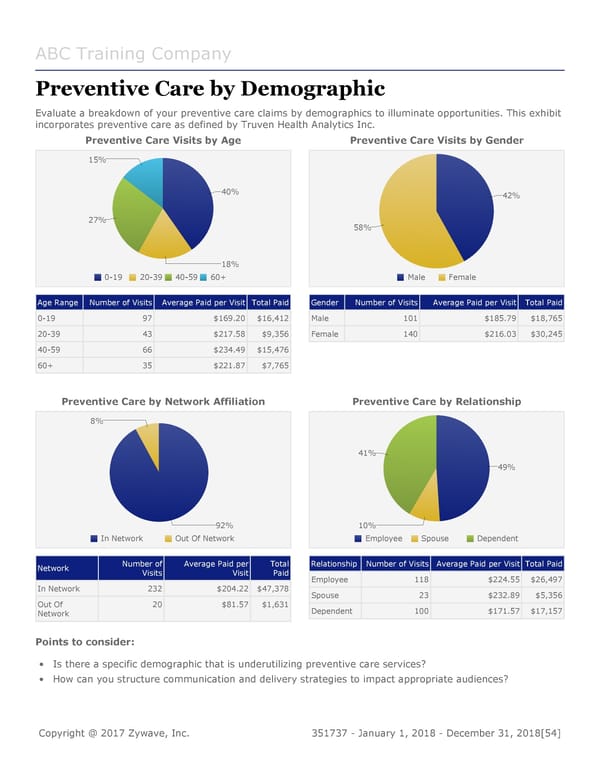
ABC Training Company Preventive Care by Demographic Evaluate a breakdown of your preventive care claims by demographics to illuminate opportunities. This exhibit incorporates preventive care as defined by Truven Health Analytics Inc. Preventive Care Visits by Age Preventive Care Visits by Gender 15% 40% 42% 27% 58% 18% 0-19 20-39 40-59 60+ Male Female Age Range Number of Visits Average Paid per Visit Total Paid Gender Number of Visits Average Paid per Visit Total Paid 0-19 97 $169.20 $16,412 Male 101 $185.79 $18,765 20-39 43 $217.58 $9,356 Female 140 $216.03 $30,245 40-59 66 $234.49 $15,476 60+ 35 $221.87 $7,765 Preventive Care by Network Affiliation Preventive Care by Relationship 8% 41% 49% 92% 10% In Network Out Of Network Employee Spouse Dependent Network Number of Average Paid per Total Relationship Number of Visits Average Paid per Visit Total Paid Visits Visit Paid Employee 118 $224.55 $26,497 In Network 232 $204.22 $47,378 Spouse 23 $232.89 $5,356 Out Of 20 $81.57 $1,631 Dependent 100 $171.57 $17,157 Network Points to consider: • Is there a specific demographic that is underutilizing preventive care services? • How can you structure communication and delivery strategies to impact appropriate audiences? Copyright @ 2017 Zywave, Inc. 351737 - January 1, 2018 - December 31, 2018[54]
 DMW Sample Report Page 53 Page 55