
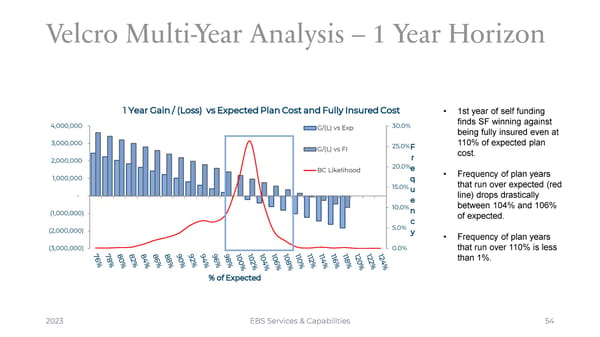
Velcro Multi-Year Analysis – 1 Year Horizon 1 Year Gain / (Loss) vs Expected Plan Cost and Fully Insured Cost • 1st year of self funding 4,000,000 G/(L) vs Exp 30.0% finds SF winning against being fully insured even at 3,000,000 G/(L) vs FI 25.0%F 110% of expected plan r cost. 2,000,000 20.0% BC Likelihood e • Frequency of plan years 1,000,000 q that run over expected (red 15.0%u - e line) drops drastically 10.0%n between 104% and 106% (1,000,000) of expected. 5.0% c (2,000,000) y • Frequency of plan years (3,000,000) 0.0% that run over 110% is less than 1%. % of Expected 2023 EBS Services & Capabilities 54
 Velcro Finalist Presentation Page 53 Page 55